Analysis of electrical signals, or also known as signal analysis, is quite a challenge for scientists and electronic design engineers. Analyzing signals is quite important since you can gain some valuable insights into their properties.
However, a signal analysis will depend on the instrument you use for the analysis. In this case, a spectrum analyzer is a common instrument that is used to analyze electrical signals. So what is a spectrum analyzer?
What is a spectrum analyzer?
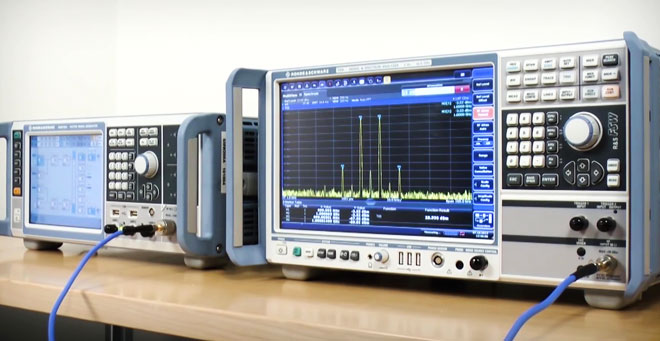
Spectrum analyzers are considered some of the most versatile and popular tools used for measurements. Its basic function is to measure the magnitude of the input signal VS the frequency. In short, it is used to measure the power of the spectrum of any type of signal.
When it comes to comparison, a vector signal analyzer can measure the phase of the input signal and the magnitude founding within the IF (intermediate frequency) bandwidth. This way, you can make in-channel measurements like spectral flatness, code domain power, error vector magnitude, etc.
Historically, vector signal analyzers are almost as same as spectrum analyzers; however, modern technology has allowed developers to include both functions in a single instrument.
The powerful analysis and measurement capabilities of these devices allow engineers to completely understand the system or device that is being studied. Of course, you would also want to understand how these devices work and other valuable insights.
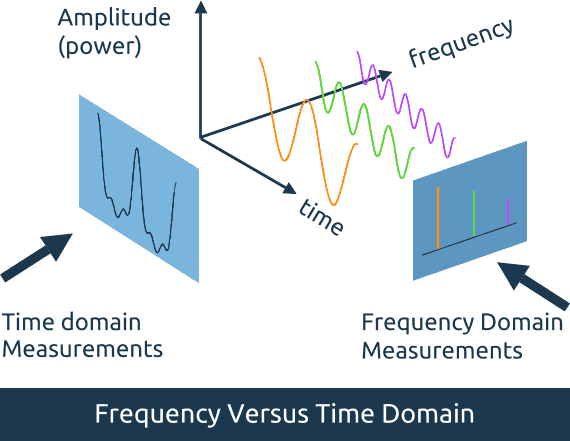
If you want to understand the performance of any system or device, the signals need to be analyzed in the frequency domain. This is exactly the job of a spectrum analyzer.
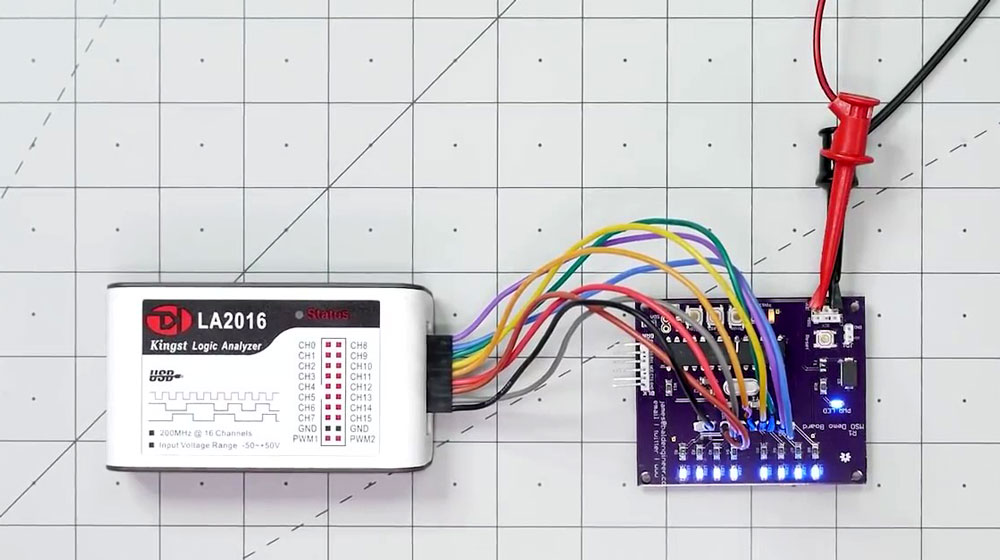
Additionally, these devices are fitted with different technological advancements that make them stand apart from different measurement tools like oscilloscopes.
Measuring signals with the help of a spectrum analyzer will reduce the amount of noise that is present in the signals, thanks to the ability of device’s ability to narrow down the measurement bandwidth.
What is a spectrum analyzer used for?
Now that we know what spectrum analyzers are, let us now understand some of their uses. Spectrum analyzers are used in a lot of different types of works related to engineering. For instance, engineers often have to check cellular radio systems to understand the harmonics of any carrier signal so that there are no interferences between systems that share the same frequencies.
One is a very peculiar problem known as the third-order inter-modulation, where two separate tones with a complex signal start modulating each other; in this case, a simple filter will not remove them.
Spectrum analyzers are also used by government agencies to look into how an allocated spectrum is being used. Different frequency bands are reserved for particular activities like emergency communications, mobile phones, wireless internet, etc. If the transmitters do not stay fixed within the allocated frequency bands, the signal energy can enter separate channels and can cause interference.
Electromagnetic interference (EMI), which is another type of interference, can stop or interfere with the operation of other systems. EMI refers to unwanted conducted or radiated emissions, like the ones from power lines or an electronic device. Hence, all electronic products undergo EMI compliance testing so that the emission levels are within the industry or government standards. In fact, some spectrum analyzers are fitted with EMI pre-compliance testing to ensure that the DUTs are within compliance.

Another common signal that spectrum analyzers are often used to analyze is noise, which mostly refers to unwanted and random variations seen on the signal amplitude. At times, they can even completely mask the signal.
Measurements like phase noise, signal-to-noise (SNR) ratio, and noise figure can help you understand the performance of the overall system or device.
How does a spectrum analyzer work?
While traditional spectrum analyzers like vector signal analyzers (VSAs) and swept spectrum analyzers (SSAs) will showcase your signals in modulation and frequency domains, measurement in modern spectrum analyzers still face a lot of different challenges. Some of them include frequency-hopping signals, capturing spread-spectrum, finding and analyzing dynamic and transient signals, observing signals that are masked by noise, and more.
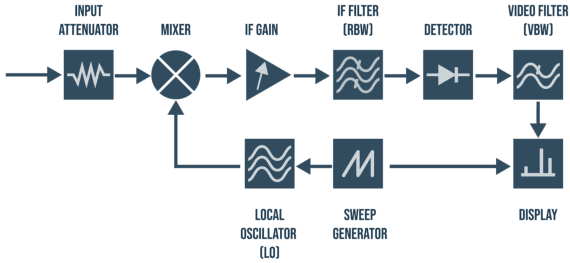
Modern spectrum analyzers overcome these problems by making use of real-time digital signal processing (DSP) to perform analysis on the signal. In contrast to post-acquisition processing present in old VAS devices, DSP occurs before memory storage.
Thanks to real-time processing, you will be able to look for events that are otherwise invisible in older analyzers. This data can then be used to perform any type of analysis like calibration, signal conditioning, etc.
The real-time tech used in modern spectrum analyzers also open the door for a wide range of features like digital IQ streaming of digitized data, real-time demodulation so that you can listen to specific signals within a busy band, trigger specific bandwidths with power trigger, frequency mask trigger, real-time correction for analog-signal-path imperfection, etc.
All these aspects will allow you to process an uninterrupted output of signals for external storage. If you perform these signal-processing tasks, you will be able to free up valuable software-based resources.
How to use a spectrum analyzer?
There are a lot of interfaces and controls on a spectrum analyzer. While the device may look complicated, it is possible to use them once you understand what each control is used for. Here are the basics on how to use a spectrum analyzer:
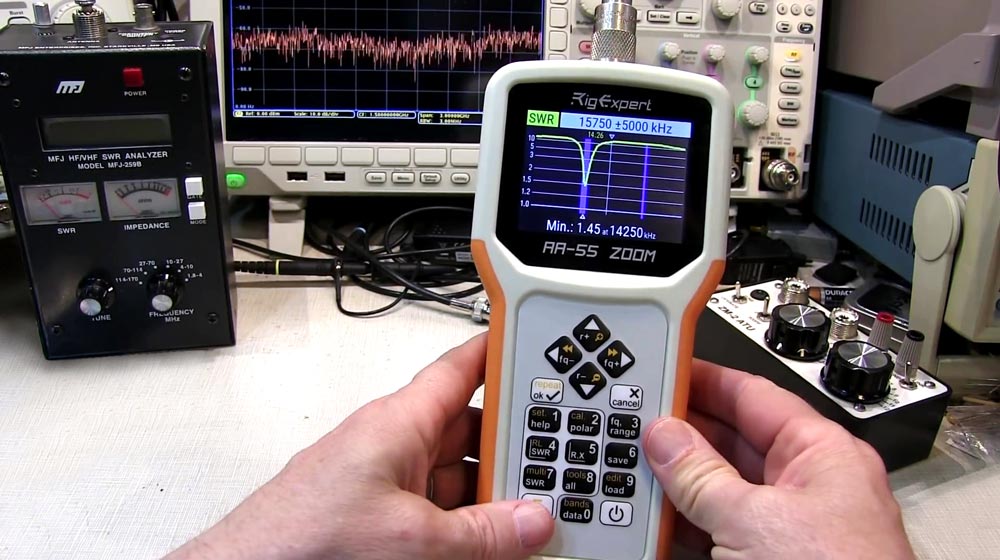
The display

When you first look at a typical spectrum analyzer, you will see the screen, which is one of the main elements of this testing device. In most cases, it should have ten major vertical and horizontal divisions each.
The device’s horizontal axis has been calibrated in frequency. You will see the higher frequencies on the right side of the display. The vertical axis will be calibrated in amplitude. While the scale is logarithmic, you also have other scales (like linear ones) for specialized works.
Normally, a logarithmic scale is used because a wide range of signals can be seen on the spectrum analyzer – the signals of interest may vary from 80dB and above. In most cases, the value of 10dB per division is preferably used. Since the scale is calibrated in dBm, you will be able to see and compare the differences between two different signals.
Modern spectrum analyzers are also fitted with different technologies like keys so that you are provided with more functions.
Setting the frequency
There are two different aspects of setting the frequency of a spectrum analyzer. There are two different selections that you need to make:
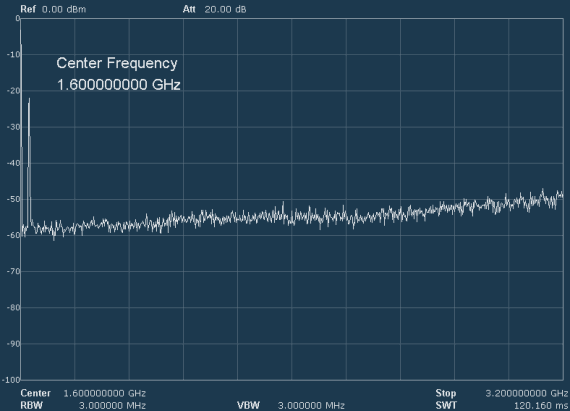
Center frequency
As the name suggests, this selection will allow you to set the frequency of the scale to any chosen value. The location is typically where the signal will be monitored. This way, the main signal will be seen in the center of the display while the frequencies will be seen on any of the two sides.
Span
When you are using the spectrum analyzer, the extent of the frequency coverage can be monitored via the span selection. The span is defined as the number of bandwidth divisions seen on the graticule. Alternatively, it can also be said as the maximum number of extents of the calibrations seen on the graticule.
Another option available here is to set the start and stop of the scan so that the span can be expressed as the difference between the start frequency and the stop frequency and that they are equal to the span. By cutting down the span, you will see the signal with a better resolution, thereby allowing you to take a closer look at the components of the signal.
Top and bottom frequencies
This is an optional alternative – there are some types of spectrum analyzers that will allow you to enter or stop the frequencies for the sweep from top and bottom.
Attenuation and gain frequencies
These are some other controls seen on a typical spectrum analyzer; mostly, these controls will fall in either one of the two available categories – the first one is associated with the attenuation or gain of the sections in a spectrum analyzer.
If the sections of the spectrum analyzer start getting overloaded, then the signals being generated within the device will become spurious. If you add extra attenuation via the input attenuator, this issue can be prevented. However, if you add too much attenuation, additional gains will be seen in the later stages and can also increase the background noise level, which will mask signals of lower levels. Hence, you need to set the relevant gain levels carefully so that the performance remains optimum.
Mostly, the overall gain needs to be adjusted in such a way that the peak of the signal appears on the top of the display; a gap of 10dB should be more than enough. This way, the signals will not appear as spurious and can be seen easily. If the reference levels are reduced too much, the value of the signals will also decrease and get closer to the residual noise level. Hence, a difference of 20dB between the noise and signal should be sufficient.
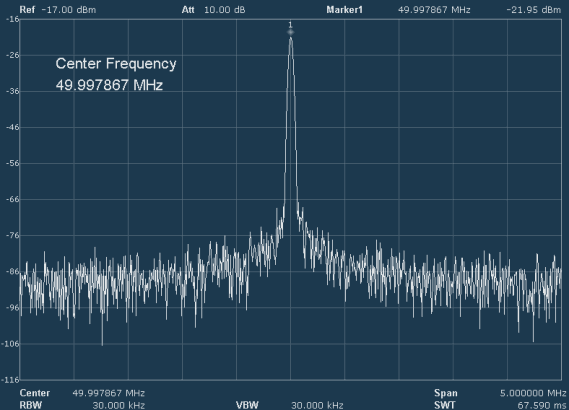
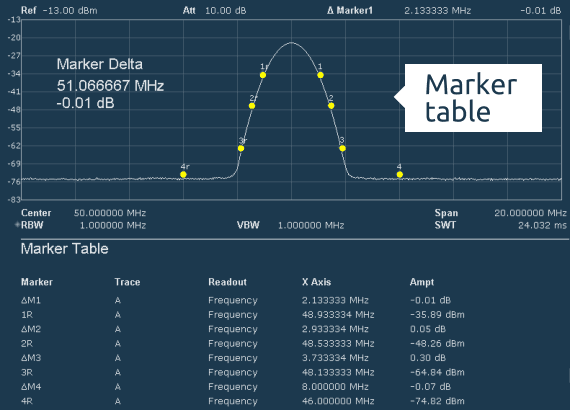
Markers
One of the most important and useful aspects of a spectrum analyzer is its ability to incorporate and use markers. Markers are used to detect levels of different waveform portions and for measuring the levels of different signals. Additionally, you can also compare figures like the levels of spurious signals or harmonics, depending on the carrier.
These markers can be set to select the different peaks or measure at a certain point, like a knob or wheel, which are generally used to set this frequency. Markers are usually controlled by the function key or on the buttons around the screen.

Modern spectrum analyzers are fitted with a lot of different features, especially when compared to their age-old analog counterparts. Apart from features like markers, these devices are fitted with a lot of different facilities that can be accessed on the buttons, knobs, and keys, including options and routines for measuring noise figure and phase noise.
Another important capability of spectrum analyzers is for signal spectra and its easy testing. A mask can be set to mention the limits in which the spectrum of the signal. This mask may appear on the screen and you will be able to see if the signal falls out of this particular gap. This is just the basic way of understanding how spectrum analyzers work.
How to read a spectrum analyzer?
A spectrum analyzer is considered a useful tool when it comes to EMI troubleshooting, RF component testing, and broadcast monitoring. While using the device is one thing, reading the analysis is a different ball game altogether.
We need to start by talking about the formation of the square wave from the basic sine wave and the odd harmonics. The description of the pulse signals will be based on the sequence of the periodic pulse. If there are enough harmonics on the graph that correlate to the right phases and amplitudes, you will find that the waveform will have the shape of a square.


A rectangular pulse is where the phase and relative amplitude of the harmonics (both odd and even) get changed. This way, you can plot an infinite number of waveforms. This device will un-plot complex waveforms, with each harmonic being contained within this waveform.
V(f) = τ Sin [ω (τ/2)]/ω (τ/2)
A pulse train can be seen if the pulse keeps repeating at regular time intervals. Since the waveform is periodic, you may have to expand it into the Fourier series if you want to understand harmonic content.
The resolution bandwidth will help you read and understand a spectrum analyzer. In simple terms, the bandwidth can be defined as the span of frequencies that are focused on particular events. For instance, the bandwidth of the signal is the frequencies being spanned within the transmission. The bandwidth will define the range of the frequencies that are used for the measurement.
Smaller resolution bandwidths provide you with frequency resolution and also provide you with the ability to differentiate signals in frequencies that are tied in close. However, why the smallest resolution bandwidth can’t be used for all measurements? This is because of the sweep time, which is the time length it takes to sweep the detector from the start till the end of the frequency.

For instance, the measurement of two different signals is separated by 20kHz; these traces can be collecting by using a resolution bandwidth of 3kHz (pink), 10kHz (yellow), and 30kHz (blue).
You may also observe that the frequency between the two signals may remain unchanged. When the resolution bandwidth is less than the difference between the frequencies of the signals, only then does the signal separation look clear.
What is a spectrum analyzer Epic FAQ
What are the features of spectrum analyzer?
Spectrum analyzers are electronic devices that measure the frequency spectrum of a signal. Here are some common features of spectrum analyzers:
- Frequency range: The range of frequencies that the analyzer is capable of measuring.
- Resolution bandwidth (RBW): The width of the frequency band that is analyzed.
- Amplitude measurement: The ability to measure the strength or power of the signal in units such as decibels (dB).
- Sweep time: The time it takes for the analyzer to measure the entire frequency range.
- Display: A graphical representation of the frequency spectrum of the signal, typically in the form of a bar graph or line graph.
- Markers: A feature that allows the user to mark specific points on the display and measure their amplitude and frequency.
- Trace memory: The ability to store and recall multiple measurement traces.
- Filter functions: The ability to apply filters to the signal to remove unwanted frequencies or improve measurement accuracy.
- Remote control: The ability to control the analyzer remotely via a computer or other device.
- Connectivity: The ability to interface with other devices, such as signal generators or oscilloscopes, to perform more advanced measurements.
These are just some of the features that are commonly found in spectrum analyzers. The specific features and capabilities of an analyzer will depend on the make and model, and the intended application.
How do calibrate spectrum analyzer?
Calibrating a spectrum analyzer involves several steps to ensure accurate measurement results. Here is a general outline of the calibration process:
- Connect a known reference source to the input of the analyzer.
- Configure the analyzer for the specific measurement, including frequency range, resolution bandwidth, and measurement units.
- Perform a calibration of the reference source to establish a known frequency and amplitude relationship.
- Adjust the analyzer’s tracking generator (if available) to match the reference source frequency and amplitude.
- Perform a cable calibration to account for any cable loss and delay.
- Set the analyzer’s reference level and ensure that it is properly calibrated.
- Perform any additional calibrations that may be required, such as adjusting the analyzer’s power measurement or setting the sweep time.
It’s important to note that the specifics of the calibration process may vary depending on the make and model of the spectrum analyzer and the type of measurement being performed. The manufacturer’s manual or technical support should be consulted for detailed instructions.
What is the difference between spectrum analyzer and signal analyzer?
Spectrum analyzer and signal analyzer are two types of instruments that are used to measure signals, but they have some differences.
Let’s define spectrum analyzer. A spectrum analyzer is a device that measures the frequency spectrum of a signal. It provides a graphical representation of the signal’s frequency content, allowing the user to see the power distribution across different frequencies. Spectrum analyzers are typically used to analyze signals in the RF (Radio Frequency) and microwave frequency ranges.
A signal analyzer, on the other hand, is a more general term that can refer to a wider range of instruments. A signal analyzer typically provides more advanced measurement capabilities than a spectrum analyzer, including the ability to analyze signals in the time domain, frequency domain, and even the phase domain. Signal analyzers are used in a wider range of applications, including audio, telecom, and test and measurement.
In summary, a spectrum analyzer is a specialized tool used to measure the frequency spectrum of a signal, while a signal analyzer is a more general term that can refer to a wider range of instruments used for analyzing signals.
What is a spectrum analyzer – Final Word
If you are dealing with instruments and systems related to radio frequencies and/or microwave frequencies, a spectrum analyzer is a must-have tool in your workshop because it allows engineers and technicians just like you to quickly and easily visualize the frequency composition of the signal and identify any problems such as interference or frequency drift.
Did you like our What is a spectrum analyzer post? Feel free to let us know what do you think and don’t forget to check our other posts – Best Spectrum Analyzer might be interesting for you.