A spectrum analyzer is a piece of testing equipment that can be used to visualize and measure signal amplitude over a certain frequency range. These signals are then showcased in a frequency VS amplitude graph – the frequency range is shown on the X-axis while the amplitude on the Y-axis.
The amplitude is mostly expressed in the logarithmic scale (dB), mostly because of space restrictions. However, if you apply some common math-solving skills, you will be able to measure the power of the signal with ease. Some spectrum analyzers will allow you to read the amplitude in Watt.
As for the frequency, it is linear and expressed in Hz. The frequency range can be set specifically to the range you wish to inspect. You will be able to analyze harmonic distortions, spectral masks, inter-modulation distortion, phase noise, spurious signals, signal frequency, and signal level. Looking for signal interference will become extremely easy. Additionally, you can also use it for other purposes like HAM radio testing, antenna matching, wireless connection testing, etc.
Now that you have a basic idea of what a spectrum analyzer is, here are some of the best in the market today.
1. Rigol DSA815-TG Tracking Generator Spectrum Analyzer – Best Overall

Rigol DSA815-TG Tracking Generator Spectrum Analyzer
- Spectrum Analyzer, 9kHz to 1.5GHz with preamplifier and tracking generator
- 9 kHz to 1.5 GHz Frequency Range
- 1.5 GHz Tracking Generator (TG)
- Multiple markers and marker table functionality
The Rigol DSA815 is considered one of the top spectrum analyzers that you can use to sweep the frequencies between 9kHz and 1.5GHz. It is considered the best option for analyzing applications like FM radio spectrums.
Best features
The Rigol DSA815 is capable of displaying all frequencies between 9kHz and 1.5GHz, which is not considered a good idea since you will not see any amplitude.
Thanks to the span function, you will be able to look into frequencies of interest directly on the screen. This appliance allows you to perform the smallest span – 100Hz – that allows you to see the signals with utmost clarity.
The resolution bandwidth is adjustable from 10Hz to 1MHz, which will separate signals that unite with another signal of a broad resolution bandwidth. For smoothing out the noise, you can also adjust the video bandwidth between 1Hz and 3MHz.
- This spectrum analyzer is quite lightweight and compact, allowing you to carry it around easily
- The device is fitted with a high-resolution LCD
- The functions and features available justifies the cost price
- The appliance is quite expensive
- Since the measurement range is only up to 1.5GHz, you cannot use it to inspect higher frequencies
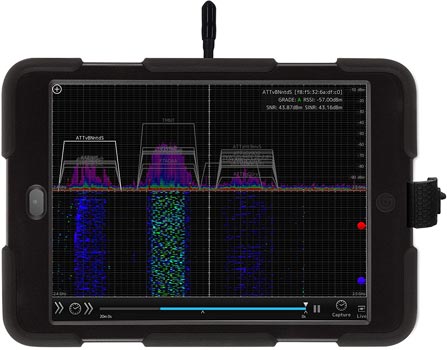
OSCIUM WiPry 2500x: Wi-Fi Spectrum Analyzer
- 2.4 GHz and 5 GHz Spectrum Analyzer views all interference including ZigBee, Bluetooth, Baby Monitors, etc
- Android, iOS, Mac, PC Supported
- Scan and Troubleshoot Wi-Fi
- SSID’s and RSSI
2. OSCIUM WiPry 2500x: Wi-Fi Spectrum Analyzer – Best Pricing
If you are looking for a spectrum analyzer that is pocket-friendly and can measure higher frequencies like Wi-Fi singles, then this OSCIUM WiPry 2500x is a good choice. In fact, this particular analyzer has been designed for frequencies greater than 2.4GHz or even 5GHz.
Best features
WiPry 2500x can be used to analyze signals from different appliances like Bluetooth connection, Zigbee, and even the baby monitor. If you make use of these devices and experience unwarranted interferences, you can make use of the device to look for what is wrong and fix the problem immediately.
The WiPry 2500x is one of the simplest spectrum analyzers in the market today. It is not larger than the palms of your hand. It also features intriguing software that works amazingly. All you need to do is install the app on your mobile device or computer and then you can immediately start analyzing your Wi-Fi signals. The app works perfectly on your iOS and Android devices as well.
The appliance can also visualize your RF and SSID’s activity on both frequencies; some of the items included in this are microwave ovens, garage door openers, cordless phones, and baby monitors, to name a few. You will be able to improve the grade of your wireless devices with the help of the WiPry 2500x.

- The frequency range of the WiPry 2500x is quite high, which makes it perfect for certain devices
- The cost of the appliance is very pocket-friendly
- The app can be downloaded on your Android and iOS devices
- Not a good choice for lower frequencies
- Sadly, the company has a very poor customer support service
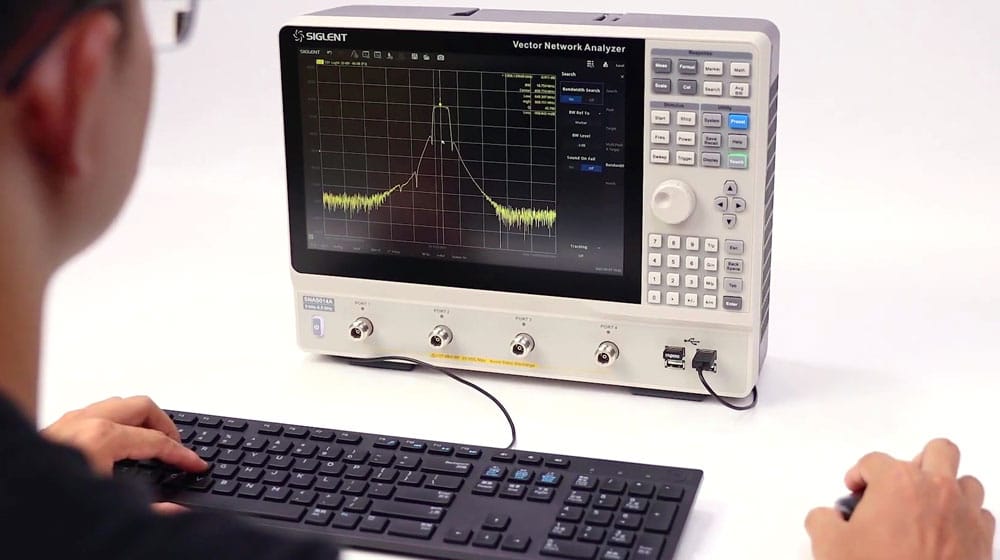
3. Siglent Technologies SSA3021X-TG Spectrum Analyzer – Best Design

Siglent Technologies SSA3021X-TG Spectrum Analyzer
- All-Digital IF Technology
- Frequency Range from 9 kHz up to 2.1 GHz
- -161 dBm/Hz Displayed Average Noise Level (Typ.)
- 1 Hz Minimum Resolution Bandwidth (RBW)
The Siglent SSA3021X-TG is a great choice if you are looking for something that has a very practical design and can be carried around easily. Additionally, it is also priced very nominally and can be used for a lot of different applications. It is fitted with a tracking generator as well.
Best features
The SSA3021X-TG is fitted with a display that is larger than other analyzers; the screen measures about 10.1-inches and allows you to monitor the trace without any hiccups. The device can easily scan any frequency between 9kHZ and 2.1GHz, thereby allowing you to monitor a wide range of devices.
The SSA3021X-TG’s resolution measures to 10Hz, which is great for carefully and accurately finding two closely-separated signal details. You can also display four traces with different resolution bandwidth. Hence, you can eliminate the guessing work of identifying between two signals of 20Hz simply by getting the resolution bandwidth smaller than the 20Hz range.
- The frequency range of the SSA3021X-TG is quite decent – between 9kHz and 2.1GHz
- The device is fitted with a 10.1-inch display for a clearer view
- The pre-amplifier will further amplify even the weakest signals
- There are no physical power switches to completely remove the power without having to disconnect the cable
- The performance of 3GHz is quite common and can be seen in cheaper alternatives as well
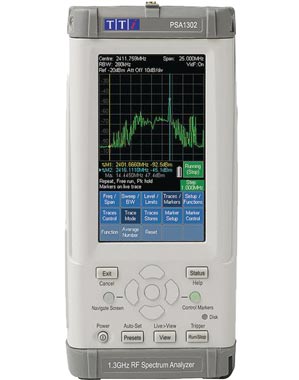
AIM-TTI INSTRUMENTS PSA1302 SPECTRUM ANALYSER
- Handheld 1.3GHz Spectrum Analyser
- 1 MHz to 1300 MHz frequency range
- Flatness:Better than +- 1.5 dB over the range1 MHz to 1300 MHz
4. AIM-TTI INSTRUMENTS PSA1302 SPECTRUM ANALYSER – Ease of Use
The AIM-TTI PSA1302 spectrum analyzer is an easy-to-use analyzer that has a high degree of portability and fast mobility. Apart from these, the device is known to provide high-quality spectrum analysis and is fitted with a lot of great functionalities.
This is a hand-held device that will not disappoint you in any way. You can carry it around in any location and can be used with utmost reliability.
Best features
While it may be a hand-held analyzer, it provides a great range of measurement – between 10MHz and 3.6MHz. In this range, you can cover a lot of different aspects like SHF, UHF, VHF, and HF. In short, you can analyze a lot of different applications like mobile devices, Wi-Fi, FM radio, and TV broadcast. If you want the best signal details and visual experience, you need to specify the frequency span down to 27kHz.
When it comes to amplitude range, the PSA1302 will allow you to select between different units like uW, mV, dBuV, or dBm. The reference point can be placed between 0dBm and +20dBm, or even lower than -20dBm. You will notice on the screen that the amplitude range is 84dB from the reference level.
- This particular spectrum analyzer is quite portable and can be carried around with ease
- The frequency range is very impressive – between 10MHz and 3.6MHz
- The overall specifications of the appliance are worth the cost
- The device is one of the more expensive analyzers in the market today
- While it is small, the analyzer could have used some protective coverings
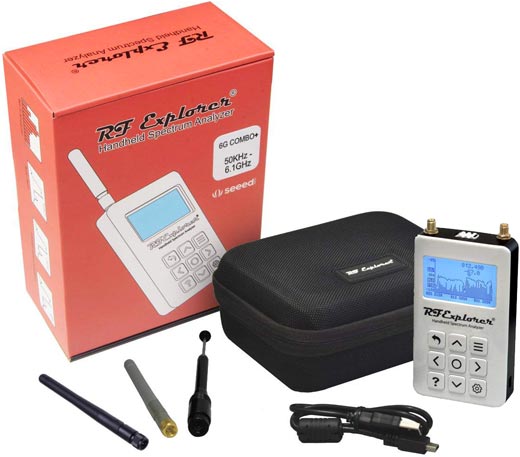
5. LATNEX SPA-6G Combo RF Explorer and Spectrum Analyzer – Best Portability
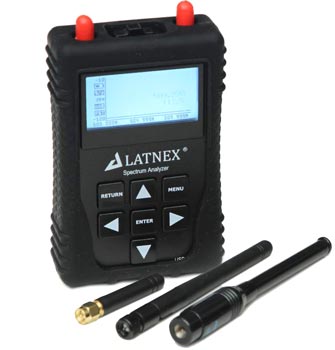
LATNEX SPA-6G Combo RF Explorer and Spectrum Analyzer
- Impressive wide frequency band from 15MHz-2.7GHz
- WiFi analyzer mode ( WIFI Combo)
- Free downloadable professional RF and Wifi Chanel Analyzing software
- Deluxe carry case
The Latnex SPA-6G is one of those spectrum analyzers that you can carry around with the utmost ease. While it is known for being quite portable, it also functions well on all known frequency band spectrums.
Best features
The SPA-6G is fitted with an integrated frequency synthesizer and a double-balanced mixer that offers low cost, low consumption, compact size, and high performance. This device can easily be used in indoor and outdoor environments and can be connected to a computer or laptop for added functionalities via the USB connector.
The SPA-6G is fitted with three antennas and two SMA connectors – the whip helical for the 2.4GHz band, the rubber duck for 5.8GHz, and the Nagoya NA773 telescopic antenna for other sub-GHz frequencies. These are precise band antennas that can be used to cover a wide range of frequencies like DTV, CATV, satellite, GPRS, GSM, LTE, wireless video and audio, Bluetooth, and Wi-Fi.
The SPA-6G is also available in a package that includes the analyzer and an aluminum protective carrying case; the package also includes additional accessories. With the help of this case, you can easily carry the analyzer around without worrying about it getting damaged. The case will also keep all the components and parts very organized.

- The Latnex SPA-6G is one of the most portable analyzers available in the market
- The appliance is packed with a dedicated aluminum protective carrying case
- The large display allows you to view the readings with ease
- The device is quite expensive
- The analyzer could have been fitted with some more options for the price
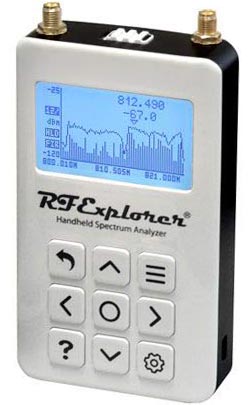
RF Explorer Digital Handheld Spectrum Analyzer
- Internal LNA amplifier and selectable attenuator for additional power range handling
- Low-frequency support from 50KHz covering LF, MF, HF, VHF, and UHF
- High-frequency support covering all ranges up to 6.1GHz with no gaps
- High capacity internal Lithium battery for 10hs+, rechargeable by USB
6. RF Explorer Digital Handheld Spectrum Analyzer – Best Features
The RF Explorer handheld spectrum analyzer is one of the top analyzers in the market today – designed specifically for UHF, VHF, HF, MF, and LF. Overall, the device can easily sweep across frequencies ranging between 50kHz and 960Mhz.
Best features
As mentioned above, the range of frequency is quite wide. Thanks to this feature, you will be able to use it on applications like RFID, ISM, GSM, DTV and TV, and FM radio. The size is compact and can easily be carried around in your pocket.
While the size may be small, it is fitted with all the specs that you will need on the job. Also, its dynamic range is wide – between -125dBm and +10dBm. For a small device, its resolution bandwidth is impressive as well – automatically sets between 2.6kHz and 600kHz.
Perhaps the most astounding aspect about this analyzer is its integrated software. The program can be installed easily on your laptop or computer; all you need to do then is connect the appliance via the USB cable. This way, you will be able to look and study the signal trace better, along with viewing the specs on your computer/laptop screen.
- Thanks to its lightweight, the RF Explorer can be carried around with ease
- This device is fitted with a lot of features, which make it quite versatile
- The software is multi-platform and can be used on all operating systems like Mac and Windows
- While it is lightweight, the RF Explorer is also very delicate and prone to damage
- The software could have had some more features like data logging
Best Spectrum Analyzer – Buying Guide
There are a lot of parameters and factors that one needs to consider while looking for a spectrum analyzer. Some obvious ones include the acceptable price limitation and the environment in which you will use the device, whether benchtop or USB. Apart from these, there are some other considerations you need to remember if you want to buy the right spectrum analyzer.
Range of frequency measurement
As the name suggests, the frequency measurement range is related to the frequencies that the analyzer can sweep across. This is the first and foremost consideration you need to remember while looking for the best spectrum analyzer.
For example, let us consider that you want to test your Wi-Fi signal. The analyzer needs to cover a frequency range that includes 2.4GHz (the most common frequency for Wi-Fi signals). In short, you need to understand the use of your spectrum analyzer to figure out the frequency measurement range. This means that if you are using a spectrum analyzer with a frequency range between 9kHz and 1.5GHz, you will not be able to use it to measure and inspect the Wi-Fi signal.
With a higher frequency range, the price will go up. A greater frequency range will allow you to work with a lot of different applications.
Span
Span is defined as the frequency range that will be seen on the screen. It will display the start and stop of a frequency. It is mostly shorter than the frequency measurement range of what the spectrum analyzer provides. For example, if your spectrum analyzer has a frequency range between 9kHz and 1.5Ghz, you will have a smaller frequency range – anywhere between 1GHz and 1.5GHz. However, it will not show on the display 1.5GHz and 2GHz, simply because they are out of the range of measurement.
Here is another example. If you inspect the HD FM radio signals, you need to start the frequency from 87.7MHZ and stop it at 107.9MHz, since this is the range where they are run. If the span is smaller, you will be able to see better results since you will be able to observe the amplitudes or signals with ease.
In its entirety, you need to look for a spectrum analyzer that has the shortest span. The span also impacts the sweep time; a shorter span will provide you with a quicker sweep time.
Amplitude range
When your spectrum analyzer will give you the readings of the Y-axis in dBm, it means that the decibel will be said to be 1mW. If the peak signal has 0dBm, the power will be 1mW.
Hence, it is important to look for a spectrum analyzer that offers the broadest amplitude range. However, you also need to be reasonable with the type of project you pick if you want to save substantial costs. For instance, your purpose is to monitor radio signals. Since radio signals are not as strong as Wi-Fi signals, an amplitude range between -140dBm and +20dBm should be enough.
Resolution bandwidth
It is not even the resolution bandwidth whose function is to sweep across the input signal; it will only look into signals that pass through the set bandwidth. So basically, the resolution bandwidth works more like a filter.
When you are looking for a spectrum analyzer, always go for the one that offers a decent resolution bandwidth. This way, you will discover closed-frequency signals that remain hidden during the scan.
Video bandwidth
You can reduce the video bandwidth if you want to smoothen out the noise that is being displayed on the screen. This tends to happen when the noise may become too large due to certain frequency ranges; you will not be able to observe the small signals easily. One solution here is to smoothen out the noise so that you can look into the signals with utmost clarity.
While reducing the bandwidth of the video may not cause anything to measurement readings like the resolution, the sweep time will definitely be impacted. When you reduce the video bandwidth, the sweep time will increase.
Best Spectrum Analyzer – Final thoughts
Even for experts, choosing the right spectrum analyzer is not an easy task. You need to consider a lot of different factors so that you end up with the right one. Selecting the best spectrum analyzer becomes important because these devices are not cheap and you will end up spending a great deal of money on these appliances.
Also, there are not a lot of options available in the market when it comes to spectrum analyzers. There are only a few brands that manufacture these testing devices. With the help of these reviewed analyzers and buying guides, you should be able to pick the best device that suits your work.
Did you like our Best Spectrum Analyzer review? Please let us know and don’t forget to checkour other reviews.
Best Logic Analyzer – could be interesting for you!