
Oscilloscopes are considered one of the top tools for any tester or electronics engineer. An oscilloscope is electric test equipment that will allow you to see waveforms and check whether there is any problem in an electronic circuit. But how to use an oscilloscope?
Since they offer a wide range of benefits, oscilloscopes have become important pieces of test equipment for area testing electronic hardware or electronics laboratory; whether within the repair, service, electronic manufacturing, general electronics circuit design, or anywhere that waveforms and electronic circuits on them that needs to be investigated.
This piece of equipment allows you to measure electronic signals and can be found in a lot of scientific laboratories. The device has been used to observe and study varying-signal voltages on a 2-D (two-dimensional) grid that represents time.
When you connect the oscilloscope to a power source, the device will show the corresponding real-time waveform instantly. While oscilloscopes are mostly used in the fields of engineering and science, they often have been used in other fields like medicine and telecommunication as well.
How to use an oscilloscope?
Whatever type of oscilloscope you use (analog or digital), there are some basic controls that remain the same. Some of these controls include:

- You will see at least one input where the coaxial cable, or the oscilloscope probe, can be attached. However, you have to ensure that you have one of these cables.
- There will be a screen with a grid overlay, which is quite useful when you want to make the measurements using the scope.
- Volts/Div control will allow you to change the number of volts is being represented by each grid overlay’s vertical increment on the screen. In short, you will be able to zoom in and out along the y-axis.
- Time/Div is the control that will allow you to change how much time is represented by each increment on the horizontal axis of the grid overlay on the LCD. This means that you will be able to zoom in and out along the x-axis.
- Vertical position/Offsets will help you move up and down the y-axis.
- The horizontal position/Offset will help you move from left to right.
- A trigger level is a tool that will help in the stabilization of the waveform on the screen.
Setting up the device
When you turn on your oscilloscope and see a flat line, it means that nothing is connected to the oscilloscope; this is identified when the input’s voltage value does not change over time. If you see a line that is not flat, you can try to disconnect the probe. If you see a blank screen, you can try out any of the following:
If your oscilloscope has a dual-channel scope, it means that it has two inputs. You first need to press on ‘Channel 1’, which will change the color of the screen to yellow; pressing the same button again will cause the screen to go blank again.
If you press on ‘Channel 2’, the color of the screen will turn blue; alternatively, it is also possible that your oscilloscope may only have a single input or more than two. Analog scopes will not denote separate channels in different colors; it will only be shown in green.
If you get zoomed in on the blank spaces, you can try rotating counter-clockwise the Volts/Div knob to zoom out. Additionally, you can also try to turn the vertical position control until the line in the center of your screen is flat.
1.Connecting to the oscillating signal
To get to this step, you will have to have a steady signal with a constant frequency. You can even use a waveform generator (if you have one) and set it on a pulse of 2.5V amplitude at 500Hz. In case you do not have a waveform generator, you can use the following alternative:
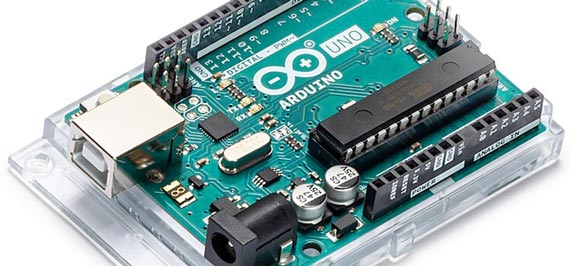
Arduino: If you are equipped with an Arduino, you can simply load the code below it. Once done, the device will start generating a square wave between 0 and 5V at 500Hz.
2.Setting the trigger
After you connect the signal, you will see a flat line turning into some kind of waveform. Next, you need to adjust and turn the Time/Div so that you can see the separation between each oscillation. Next, you need to change the vertical position and Volts/Div so that you can see the oscillations within the screen. If not, you can rotate the trigger level dial and wait for it to happen.
Alternatively, if your oscilloscope has more than a single channel, you can set the trigger to match the requirement of any channel.
When you turn the trigger level dial, you should notice that the trigger level indicator will start moving upwards and downwards. When this indicator exceeds a certain height of the waveform, the signal will start to become unstable.
This trigger level is basically a voltage level that your oscilloscope will compare the incoming signals with. Since triggering is a bit complex, most people tend to make use of external sources of the trigger to specify special trigger modes.
How does an oscilloscope work?
A traditional oscilloscope works in the same function as a cathode-ray tube television. In fact, these devices are also known as cathode-ray oscilloscopes.
When it comes to a television, the electron beams are scanned repeatedly across the screen, which is sprayed with special chemicals known as phosphors. This means that each time the beam hits the screen, it will light up the phosphors. This takes place a thousand times within a second, which is why you will see a moving picture, instead of a still one.
In an oscilloscope device, the electron beams will work in the exact same way; however, the device will draw a graph instead of building a picture. On the screen, you will see a line is being drawn on the screen; in reality, you are actually looking at a wobbling electron beam that is bumping up and down.
You need to remember that the electrical signals are fed into the X- and Y-axes to provide you with the appropriate values on your screen.

Oscilloscope Screen
- Waveform baseline icon. Shows the zero volt level of the waveform.
- Channel indicator.
- Channel scale factor.
- Time per division.
- Trigger slope.
- Date and time.
- Trigger level icon.
- Visual representation of waveform.
So, the next question here is how does the oscilloscope draw the trace? You need to imagine that you are an oscilloscope and holding a pencil at point zero on a graph paper. Now, think that your hands are tied to two electric motors – one hand on the X-axis and the other on the Y-axis. These motors are then connected to electronic circuitry that will sample different kinds of samples.
For instance, you can imagine that the X-circuit is connected to an electric quartz clock. When the clock ticks, it will forward a signal to the X-motor so that your right hand will move slightly. After a few seconds, your right hand will move along the horizontal line.
Now, let us consider that you connect the Y-circuit to a heartbeat-detection instrument. If you connect the X- and Y-circuits at the same time, your hand will start moving across the page; however, it will jump up vertically for every heartbeat. This will give you a classic heartbeat trace that you see in the hospitals.
Now, you need to replace the graph paper and a pencil with a screen and an electron beam. Now, you will understand exactly how a typical oscilloscope draws the trace. Each time a signal goes through the Y-circuit, the electron beam will jump. During this time, the trace will keep moving from left to right on the X-axis (horizontal line).
How to read oscilloscope?

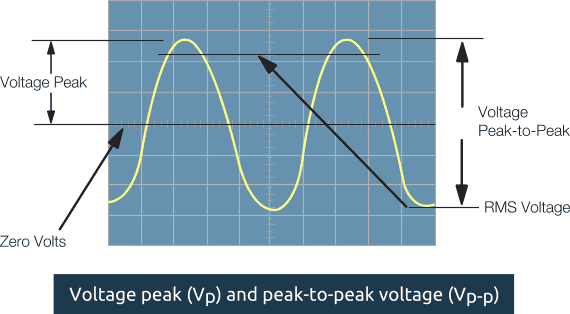
The signals in an oscilloscope are sampled as they change over time and then plotted on a display. The signal’s amplitude is plotted on the Y-axis (vertical) and the time on the X-axis (horizontal). In the case of modern electric oscilloscopes, the changes in the signal can occur within any time-space, ranging from a billionth of a second or as long as a few hours.
If you want to understand how to analyze waveform traces, you need to take a closer look at the four distinct characteristics of a waveform:
- Amplitude (the vertical axis)
- Time (the horizontal axis)
- Shape and distortion of the waveform
- Disturbances in the waveform, especially from outside
There are some common types of waveforms like:
-
Non-symmetrical
Commonly, repetitive waveforms need to be symmetrical. If you print, cut, and paste the traces one upon another, both sides need to be identical. The difference between the two waveforms could indicate a potential problem.
-
Rise and fall
This pattern is very common in pulses and square waves. This type of waveform can affect the effectiveness of the digital circuit’s timing. If you want to see an edge with a greater resolution, you may have to decrease the time per division.
-
Horizontal cursers
You need to ensure that the level is within the limits of the circuit’s operating specifications. You also need to check for consistency from a one-time point to another. You will have to keep a close look at this waveform for some time to check on any changes in the amplitude.
-
DC/Amplitude offsets
This type of waveform will determine the location of the ground reference marker. You can evaluate any DC offset and check whether it fluctuates or remains stable.
-
Period time changes/wave shape
Circuits, like oscillators, will produce waveforms within constant repeating periods. If you want to spot any consistencies, you will have to check each time period using cursers.
-
Random noise/Glitches or transients
When you derive waveforms like switches and transistors from active devices, anomalies, it can result in various phenomena like bad contacts, propagation delays, and timing errors.
How to use an oscilloscope to measure voltage?
It is very easy to measure the voltage with the help of an oscilloscope. All you need to do is follow the steps mentioned below:
- First, you need to switch on the oscilloscope and tap on the ‘Default Setup’ button. Then, you need to plug in the probe to Channel 1; however, you do not have to worry so much about the probe. Additionally, it would be helpful to have a clip that will help you prevent you from holding the wire.
- You will have to find a reliable grounding point and then connect the ground clip to it. After this, you need to connect the tip of the probe to the signal that you want to measure.
- Once you have completed the steps mentioned above, the oscilloscope will start sampling the signals. As it changes over time, it will be displayed on the screen. In case you do not see the complete signal on the LCD, you can tap on the ‘Auto Scale’ panel key to scale the waveform correctly.
- If you want further adjust how the signal is being displayed, you can adjust the horizontal and vertical knobs. With the help of these knobs, you will be able to zoom in or out and shift the direction of the signal up/down/left/right. You need to ensure that the signal spans on the vertical scale for the best measurement.
- If you wish to calculate the voltage, you need to count the number of divisions and simply multiply it by the Volts/Division (or the vertical scale). You also need to note that the number of the divisions on the Y-axis to calculate the signal’s voltage with the help of these labels.

How to calculate the frequency from an oscilloscope?
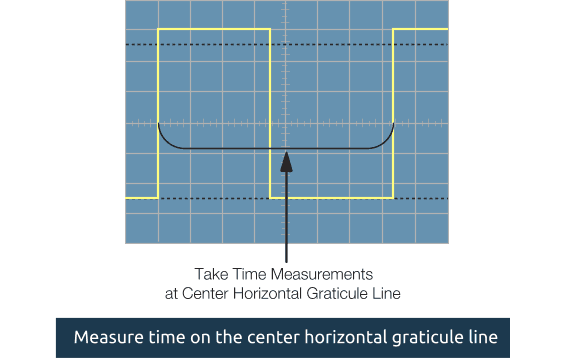
First, you have to measure the time on the oscilloscope’s horizontal scale, as well as count the total horizontal divisions from one wave end to another.
Next, all you have to do is multiply the total number of horizontal divisions by the division/time to find the period of the signal. Then, you can perform the calculation to determine the frequency – dividing it by the period.
How to use an oscilloscope Epic FAQ
What can you do with an oscilloscope?
Some common applications of an oscilloscope include:
- Debugging: An oscilloscope is used to observe and analyze electronic signals in real-time, making it an essential tool for debugging electronic circuits and systems.
- Measuring Signals: An oscilloscope can measure the voltage, frequency, and shape of electronic signals, which is useful for characterizing and verifying the performance of electronic components and systems.
- Testing Power Supplies: An oscilloscope is used to test the voltage and current waveforms of power supplies, which helps to identify any irregularities or problems that could cause damage or failure.
- Monitoring Audio Signals: An oscilloscope can be used to visualize audio signals, which helps to diagnose and troubleshoot audio systems, such as amplifiers and speakers.
- Verifying Communication Signals: An oscilloscope is used to verify the performance of communication systems, such as Ethernet, serial, and parallel communication systems, by observing the waveform of the data signals.
- Debugging Automotive Systems: An oscilloscope can be used to diagnose and troubleshoot automotive systems, such as fuel injection, ignition, and engine management systems, by observing the waveform of the control signals.
These are just a few examples of what can be done with an oscilloscope. Overall, it is a versatile tool for visualizing, measuring, and analyzing electronic signals in a wide range of applications.
Why use an oscilloscope instead of a multimeter?
An oscilloscope and a multimeter are both useful tools for measuring and analyzing electrical signals, but they have different strengths and are used in different applications.
Multimeters are designed to measure basic electrical values such as voltage, current, and resistance. They are simple to use, portable, and can be used to quickly measure these values.
On the other hand, oscilloscopes are designed to visualize and analyze electrical signals in real-time, displaying waveforms on a screen. They can measure not just basic electrical values, but also more complex waveform characteristics, such as amplitude, frequency, and rise time. Oscilloscopes are ideal for applications where it is necessary to see the shape and behavior of signals over time.
In summary, while a multimeter is useful for measuring basic electrical values, an oscilloscope provides a more complete picture of the behavior of electrical signals over time, making it a more versatile and powerful tool for applications that require detailed analysis of waveforms.
Can I use my laptop as an oscilloscope?
Yes, it is possible to use a laptop as an oscilloscope if you have the right software and hardware. To do this, you need to connect a USB or PC-based data acquisition (DAQ) device to your laptop, which will act as an interface between your laptop and the signals you want to measure. The DAQ device will convert the analog signals into a digital form that can be analyzed by your laptop. You can then use oscilloscope software to display the signals on your laptop screen and perform measurements and analysis.
It is important to note that the performance of a laptop-based oscilloscope will depend on the specifications of your laptop and the DAQ device, and may not be as accurate or have the same measurement capabilities as a standalone oscilloscope. However, for many basic applications and for hobbyists, a laptop-based oscilloscope can be a cost-effective and convenient solution.
We have prepared for you Best USB Oscilloscope review.
Can oscilloscope be used for sound waves?
Yes, an oscilloscope can be used to visualize sound waves. An oscilloscope can display the voltage waveform of an audio signal, which corresponds to the pressure variations in the air that we perceive as sound. To visualize sound waves with an oscilloscope, you need to connect a microphone or a line-level audio source to the oscilloscope’s input channel and set the appropriate scaling and triggering to display the waveform.
The display on an oscilloscope can provide valuable information about the shape and behavior of sound waves, such as the frequency content, amplitude, and phase relationships between different signals. This information can be useful for various audio-related applications, such as testing audio systems, diagnosing problems with audio equipment, and understanding the characteristics of sound signals.
Don’t forget to check our post – Best Oscilloscope for Guitar Pedal
How to use an oscilloscope – Final Word
An oscilloscope is a powerful tool for measuring and analyzing electrical signals because it provides a real-time, visual representation of the signal waveform. This visual representation makes it easier to understand and analyze the behavior of the signal over time, and to identify its frequency, amplitude, and other important characteristics. This tool should be used in any workshop where electronic is tested or fixed.
Did you like our How to use an oscilloscope post? Check our other posts – Best Oscilloscope might be interesting for you.
